- Author Jason Gerald [email protected].
- Public 2024-01-19 22:11.
- Last modified 2025-01-23 12:04.
Excel is not a graphics-focused program, but it does provide several ways to create a timeline. If you have Excel 2013 or later, you can even create it automatically from a pivot table. For older versions of Excel, you need SmartArt, a template, or you need to rearrange the cells of a spreadsheet.
Step
Method 1 of 3: Using SmartArt (Excel 2007 or Later)
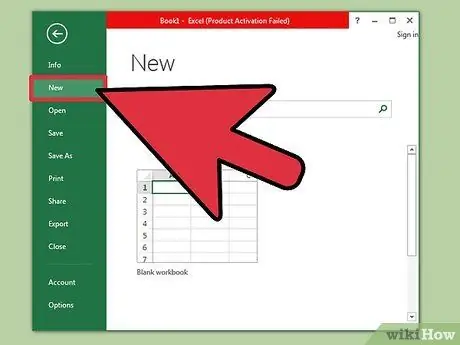
Step 1. Create a new spreadsheet
SmartArt creates a new graphic layout for you to enter data. The program doesn't modify any existing data so create a blank spreadsheet for your timeline.
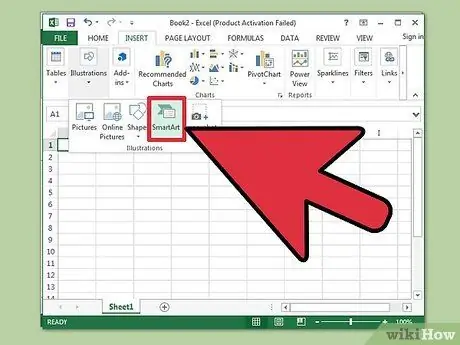
Step 2. Open the SmartArt menu
Depending on the version of Excel, click the SmartArt label on the ribbon menu, or click the Insert label and then the SmartArt button. This option is available in Excel 2007 or later.
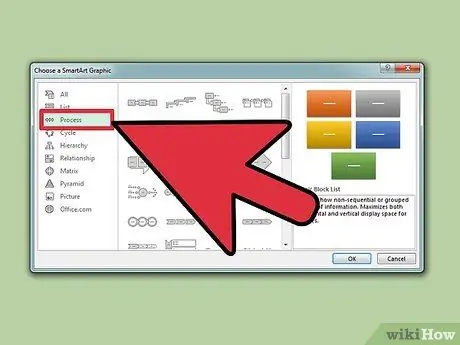
Step 3. Select the timeline from the Process submenu
Click Process on the SmartArt ribbon menu, in the Smart Art Graphic group. In the drop-down menu that appears, select Basic Timeline (arrow pointing to the right).
You can customize various other Process graphics to use as timelines. To see the name of each graphic, move the cursor over the icon and wait for the cloud text to appear
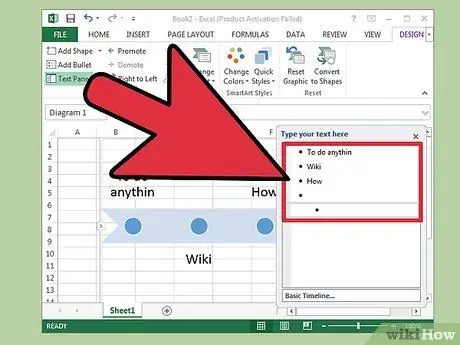
Step 4. Add more events
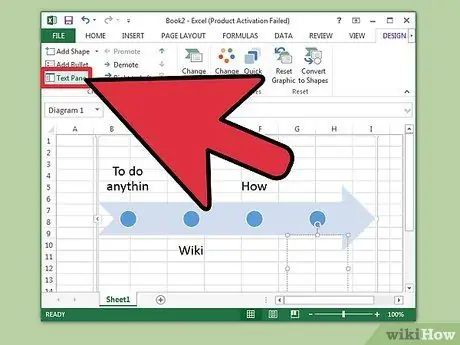
In the beginning, you just start with a few events. To add an event, select a timeline. The Text Pane options will appear to the left of the graphic. Click the + button at the top of the text pane to add a new event to the timeline.
To enlarge the timeline without adding new events, click the timeline to display a grid outline. Slide the right or left side of the box out
Step 5. Edit your timeline
Type in the Text Pane box to add an entry. You can also copy and paste data into a timeline and let Excel guess how to organize it. Typically, each column of data will be organized as a single timeline entry.
Method 2 of 3: Using Pivot Table Analysis (Excel 2013 or Later)
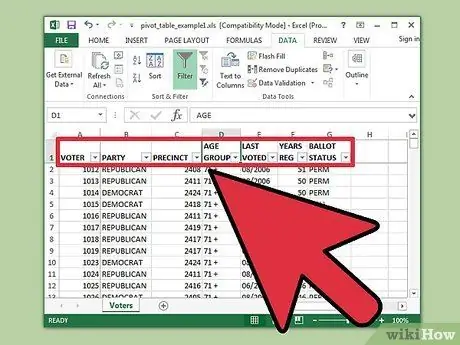
Step 1. Open the spreadsheet that has the pivot table
To be able to create timelines automatically, the data needs to be organized into a pivot table. You'll also need the pivot table analysis menu, which has been available since Excel 2013.
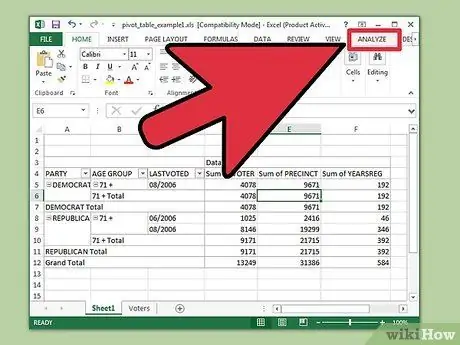
Step 2. Click anywhere in the pivot table
This will open “PIVOT TABLE TOOLS” at the top of the ribbon.
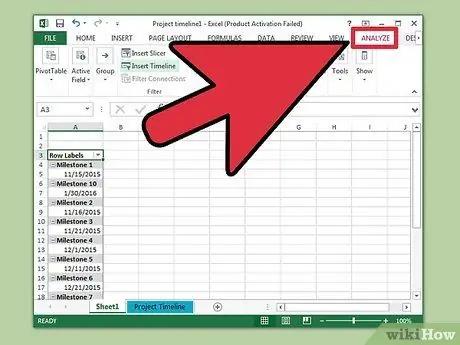
Step 3. Click “Analyze”
This will open a ribbon with options for manipulating the data in the table.
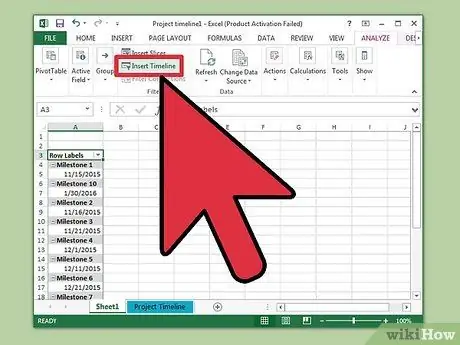
Step 4. Click “Insert Timeline”
A dialog box will appear showing a text box related to the date format. Note that Excel will not recognize the date entered as text.
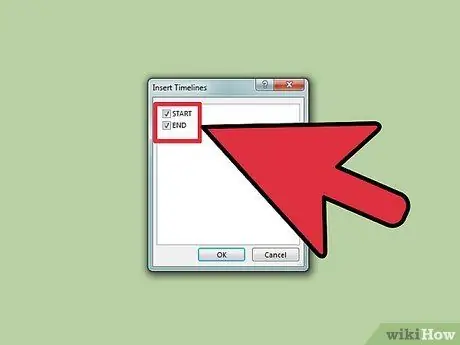
Step 5. Select the Applicable box and click OK
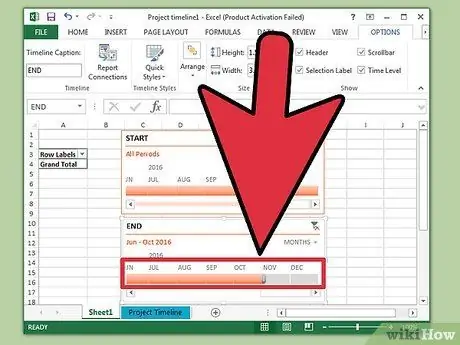
A new box that will allow you to move around in your timeline will appear.
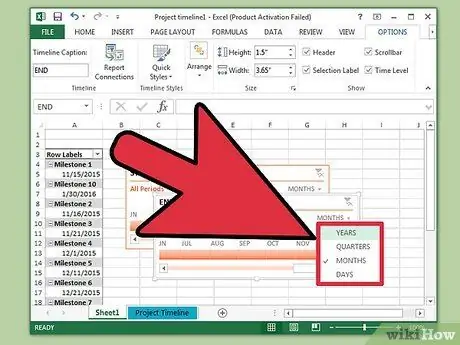
Step 6. Choose how the data will be filtered
Depending on the availability of information, you can choose how the data will be filtered (by month, year, or quarter).
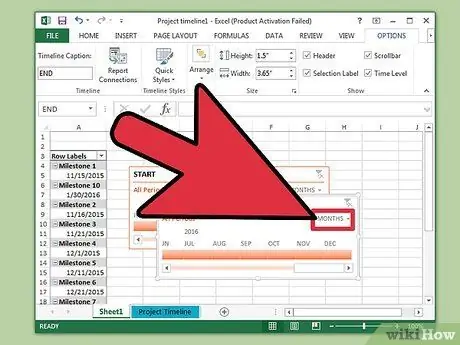
Step 7. Check monthly data
When you click on a month in the Timeline Control Box, the pivot table will show data relating to that month only.
Step 8. Expand the selection
You can expand the selection by clicking and moving the side slider.
Method 3 of 3: Using a Basic Spreadsheet (Any Version)
Step 1. Consider downloading a template
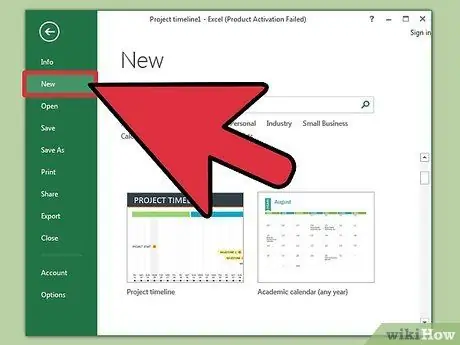
While not required, templates will make your work easier by setting a timeline structure. You can check whether Excel already has a timeline template by using the File → New or File → New from Template commands. Otherwise, look for user-generated templates on the internet. If you don't want to use a template, continue to the next step.
If your timeline of monitoring project progress is multi-pronged, consider looking for a "Gantt chart" template
Step 2. Start your own timeline from a regular cell
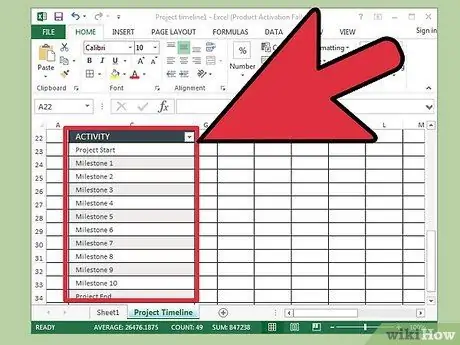
You can build a basic timeline with a blank spreadsheet. Type the timeline dates in one line, and space the black cells more or less in proportion to the time between them.
Step 3. Write down the timeline entry
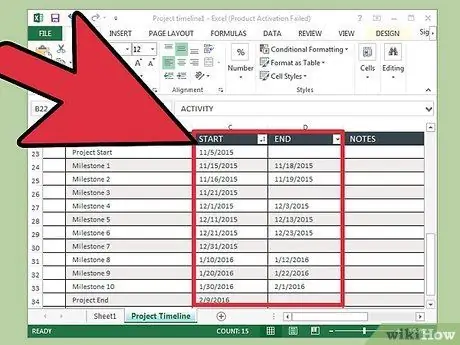
In the cell immediately above or below each date, write a description of the events that occurred on that date. Don't worry if your work looks messy.
Alternate the location of the description above and below the date for easy reading
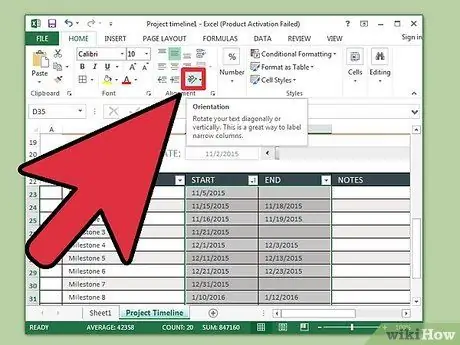
Step 4. Italicize the description
Select the row that contains the description. Click the Home label on the ribbon menu, then look under the Orientation button under the Alignment group (in some versions, the Orientation button looks like the letter abc.) Click this button and select one of the italic text options. The text that plays will become a description regarding the timeline.


