- Author Jason Gerald [email protected].
- Public 2024-01-15 08:07.
- Last modified 2025-01-23 12:04.
In statistics, the mode is the number that appears most often in a set of numbers or data. the data itself does not always have only one mode, it can be two or more (so it is called bimodal or multimodal). In other words, all the numbers that occur most often in a data can be called the mode. To find out how to find the mode, follow the steps below.
Step
Method 1 of 2: Finding the Mode Of A Data
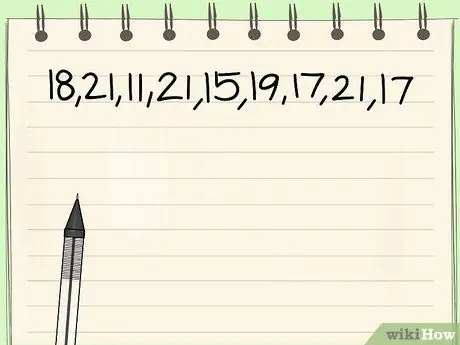
Step 1. Write down the numbers in the data
The mode is usually taken from statistical data or a list of numbers. So you need data to find the mode. It is recommended that you record or write down the data first, because finding the mode by just seeing and analyzing it in your mind is quite difficult, unless the data is very little. If you're using paper and pencil or pen, just write down the data first to sort it out later. If you're on a computer, you can use a spreadsheet program to sort them automatically later.
The process of finding the mode of a data is easier to understand if we follow it from an example problem. For now, let's use this sample data: {18, 21, 11, 21, 15, 19, 17, 21, 17}. In the next few steps we will discover the mode.
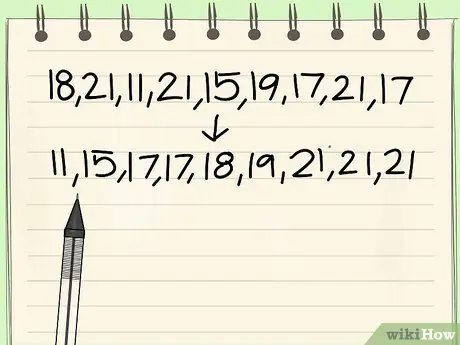
Step 2. Sort the numbers from smallest to largest
Sorting data can actually not be done. But this step will really help you find the mode because the same numbers will be next to each other making it easier to calculate. If your data size is very large, this step should be taken to reduce the error-prone rate.
- If you are using paper and pencil or pen, rewrite the data you wrote earlier in order. Start by looking for the smallest number from the data. If you find it, write it on a new line, then cross out the number in the previous data list. Find the next smallest number and do the same thing until you have sorted all the numbers.
- If you use a spreadsheet program on your computer, you can sort the list of numbers in just a few clicks.
-
In our example above, the sorted data is {11, 15, 17, 17, 18, 19, 21, 21, 21}.
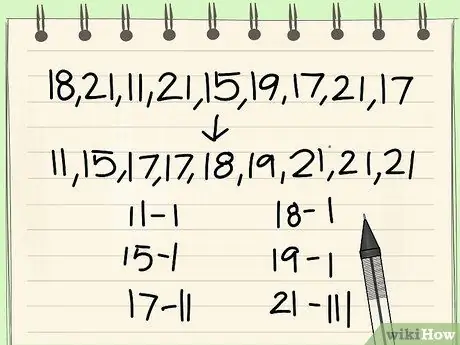
Step 3. Count the number of times a number appears
For small data, you can simply look at the data that has been sorted, then look for which number is most visible there. If your data is bigger, then you have to count them one by one to avoid mistakes.
- If you are using paper and pencil or pen, to avoid miscalculations, note how many times each number appears. If you use a spreadsheet on a computer, you can also record it in another column, or if you know, you can use the formulas provided in the program.
- In the example problem, namely ({11, 15, 17, 17, 18, 19, 21, 21, 21}), the number 11 appears once, 15 occurs once, 17 occurs twice, 18 occurs once, 19 occurs once, and 21 appears three times. From there, it is clear that 21 is the number that appears most often.
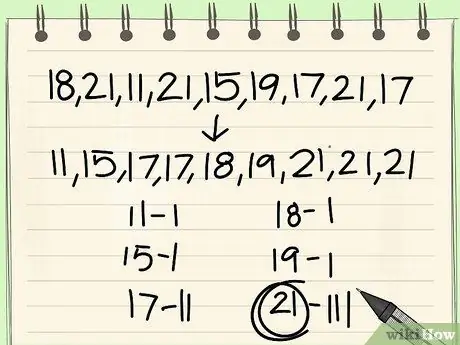
Step 4. The number that appears most often is the mode of the data
After noting how many times each of the same numbers appears, you should already know which number appears the most, which means the data mode. Remember that it is possible that a data has more than one mode. If one data has two modes, then the data can be called bimodal, while if it has three modes, it is called trimodal, and so on.
- In the example problem, the mode is 21 because it appears most frequently.
- If there is another number that also appears three times, then 21 and that number is the mode.
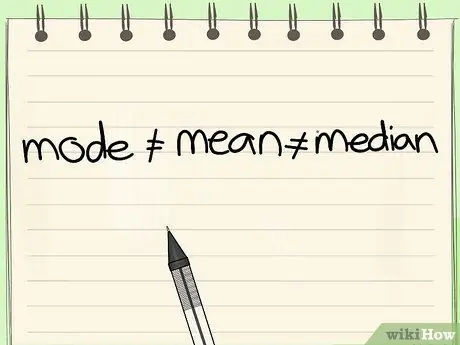
Step 5. Differentiate the mode of the data by its mean (mean) and median
The three statistical concepts are usually discussed in one discussion. Because they have similar names and sometimes have the same value, many people find it difficult to tell them apart. However, even though a data may have the same mode, median, or average, keep in mind that they are different and stand alone. Read the explanation below.
-
The mean which means the average is the sum of the data values divided by the number of data. For example, in the example problem ({11, 15, 17, 17, 18, 19, 21, 21, 21}), the total data is 11 + 15 + 17 + 17 + 18 + 19 + 21 + 21 + 21 = 160. And because there are 9 values in the data, then 160/9 = 17.78.

Find the Mode of a Set of Numbers Step 5Bullet1 -
The median is the middle value after the data is sorted and separates the small and large values from the data. In the example problem, ({11, 15, 17, 17, 18, 19, 21, 21, 21}), the median is
Step 18. because the number is in the middle, and there are four numbers higher and four numbers lower than 18 in the data. If the data is an even number, the median is obtained by calculating the sum of the two numbers in the middle and then dividing by two.

Find the Mode of a Set of Numbers Step 5Bullet2
Method 2 of 2: Finding the Mode in a Special Problem
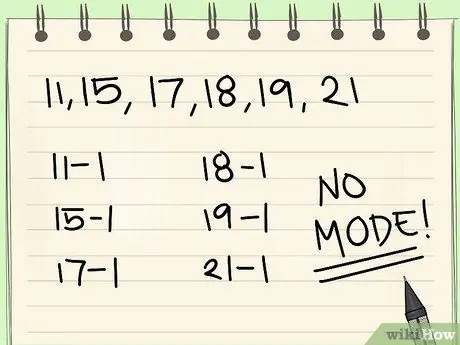
Step 1. A data has no mode if all the numbers in the data have the same number of occurrences
For example, if all numbers appear only once, the data no mode because neither number appears more frequently than the other. The same is true if all numbers appear twice, or more.
If we change the data in the example problem above to {11, 15, 17, 18, 19, 21}, which means all numbers appear once, then the data has no mode, as well as if the data is changed to {11, 11, 15, 15, 17, 17, 18, 18, 19, 19, 21, 21}

Step 2. A non-numeric data can still be searched for its mode like numeric data
Usually the data is present in quantitative or numerical form, so it can be processed by many methods. However, sometimes there are things that are not in the form of numbers. However, this mode of data can still be searched simply by searching for data (which may be in the form of statements) that occur most frequently. But you can't find the mean or median for non-numeric data.
- For example, suppose you are conducting a biological survey, which is to find out the tree species that grow in your area. The data you get is {Fire, Mango, Fir, Palm, Spruce, Spruce, Mango, Mango, Palm, Fir}. Such data is called nominal data because each data value is distinguished by a name. For this example, the mode is fir because it appears most often (five times).
- If you look at the example, there's no way you can calculate the mean or median.
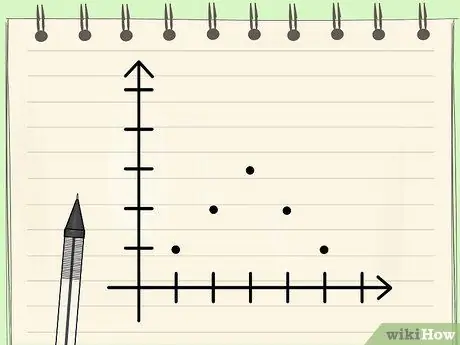
Step 3. Know that for a symmetrical unimodal data distribution, the mode, median, and mean of the data will be the same
As previously mentioned, there will be times when the mean, median, and mode of a data set are the same. One of the conditions is if a data has a strictly symmetrical distribution of values (which if drawn in graphical form will form a Gaussian bell-shaped curve). Because the distribution is symmetrical, the mode of data like this is automatically the data that is in the middle, because it must be the data that appears most often, and because it is the middle value, it means that the number is also the median. And if you do the math, the mean will yield the same number.
- For example, from the data {1, 2, 2, 3, 3, 3, 4, 4, 5}, if you draw the graph, you will get a graph of a parabola. The data mode is 3 because it appears most often, the median is 3 because the number is in the middle, and the mean is 1 + 2 + 2 + 3 + 3 + 3 + 4 + 4 + 5 = 27/9 = 3.
- Cases like this have an exception, namely when this symmetrical data has more than one mode. If this is the case, because the mean and median cannot be more than one value, then the mode will not be the same as the mean and median.
Tips
- A data can have more than one mode
- If the number of occurrences of all numbers in a data is the same, then the data mode does not exist.


