- Author Jason Gerald gerald@how-what-advice.com.
- Public 2024-01-19 22:11.
- Last modified 2025-06-01 06:05.
Break-even analysis is a tool for evaluating the profit opportunities of a business model and various pricing strategies. You can find fixed costs, variable costs, and pricing options in Excel to determine the break-even point of a product. The break-even point is the number of units that need to be sold at a set price to break even (cover production costs).
Step
Part 1 of 5: Creating a Variable Cost Table
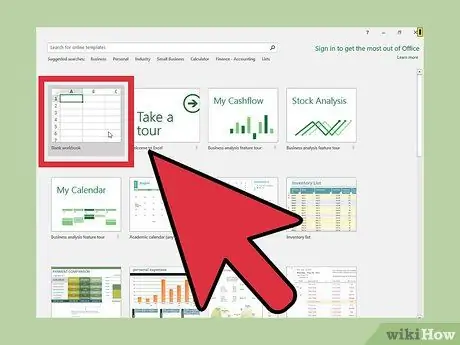
Step 1. Open Excel and create a workbook
You will need some worksheets in the workbook to keep track of all your costs.
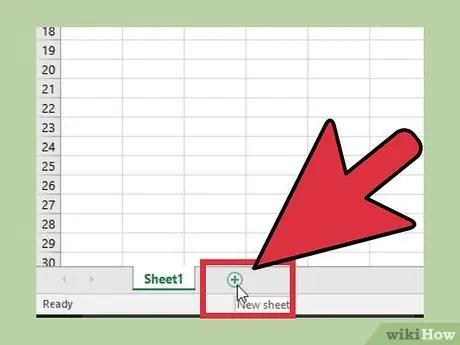
Step 2. Click the "+" button next to "Sheet1" at the bottom of the screen
This will open a new working paper.
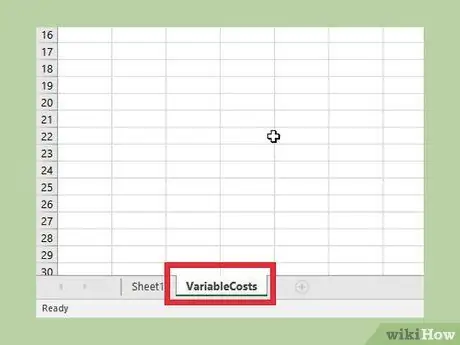
Step 3. Name the new worksheet "Variable Cost"
This worksheet will contain all the tables that monitor all variable costs, such as shipping costs, commissions, and so on.
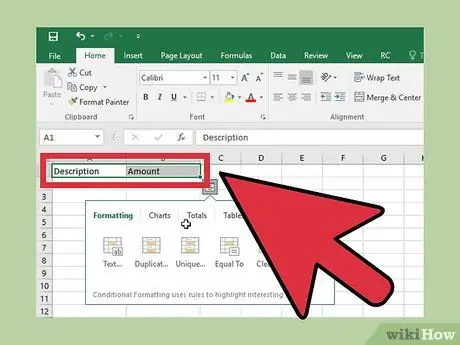
Step 4. Create a title label for the new worksheet
To create a standard variable cost table, enter “Description” into cell A1 and “Amount” into cell B1.
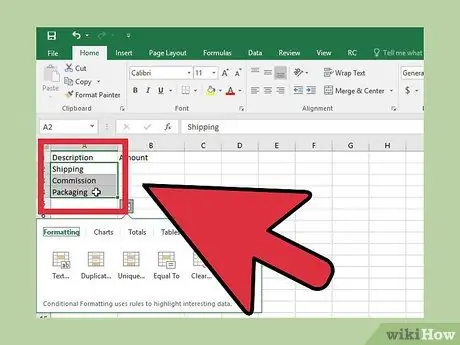
Step 5. Enter your business variable cost name in column A
Under the “Description” heading, enter the type of product variable costs to be handled.
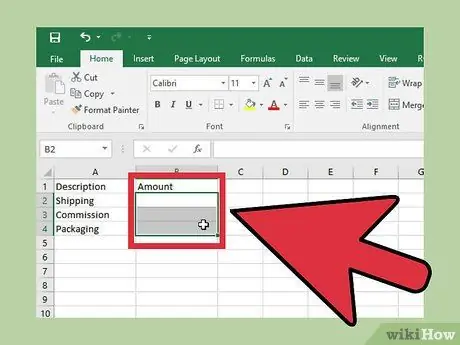
Step 6. Leave column B ("Amount") blank for now
This column will later be filled with costs that actually occurred during the process.
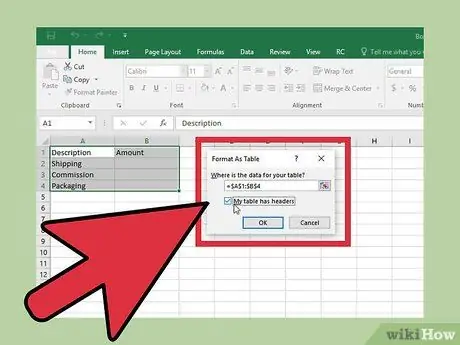
Step 7. Create a table from the entered data
Turn data into tables so you can easily enter them into formulas:
- Select all data, including the title row and blank cells, by clicking and dragging the mouse cursor across all cells.
- Click the "Format as Table" button. You'll find it under the Home label. If you're using Excel for Mac, click the Tables label, click the " New " button, and select " Insert Table with Headers ".
- Check the box " My table has headers ". Thus, the first row label will be set as the title label.
- Click the "Table Name" box in the top right corner and change the name to "Variable Cost"
Part 2 of 5: Creating a Fixed Cost Table
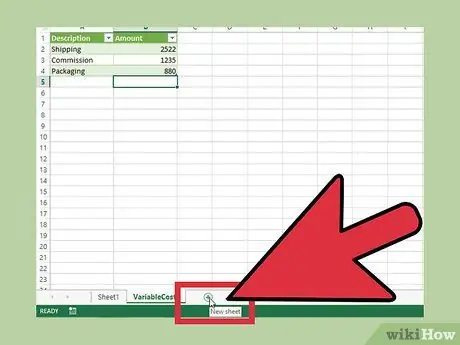
Step 1. Click the "+" button next to "Variable Cost" at the bottom of the screen
This will open a new working paper.
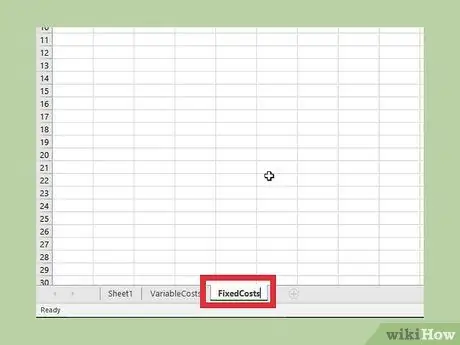
Step 2. Rename the new worksheet to "Fixed Costs"
This worksheet will contain all of the product's fixed costs, such as rent, insurance, and other costs that don't change.
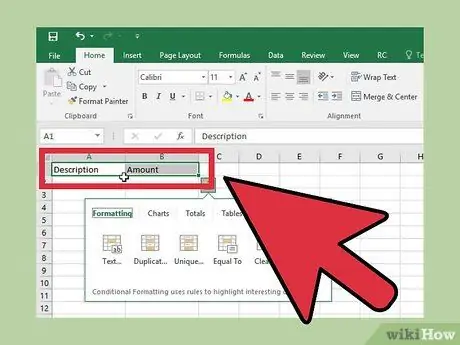
Step 3. Create a title label
As with the Variable Cost worksheet, create a label "Description" in cell A1 and a Label "Amount" in cell B1.
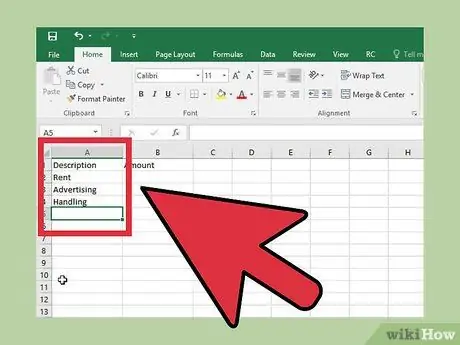
Step 4. Enter the names of your fixed costs in column A
Fill in the first column with a description of the fixed costs, for example “Rent”.
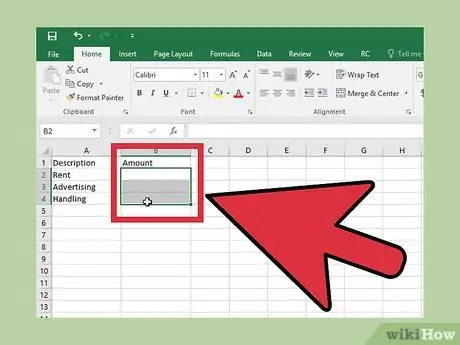
Step 5. Leave column B (“Amount”) blank for now
You will fill in these costs after completing all the paperwork.
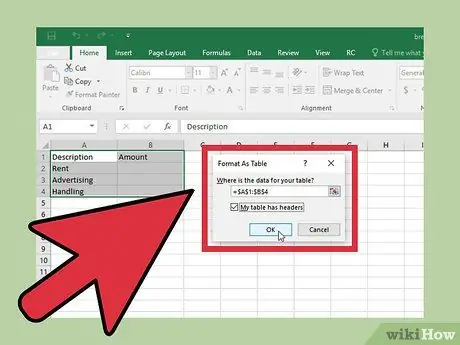
Step 6. Create a table from the data that has been entered
Select everything you have created on this worksheet, including the title:
- Click the "Format as Table" button in the Home label.
- Check "My table has headers" to change row 1 to table title.
- Click the "Table Name" box and enter the table name "Fixed Costs"
Part 3 of 5: Creating a Break-Even Worksheet
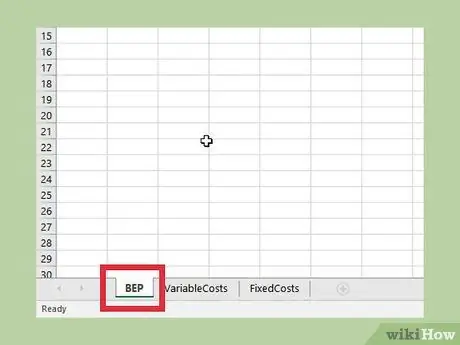
Step 1. Rename Sheet1 to "BEP" and select it
This worksheet will hold your main BEP (Break Even Point) chart. You don't have to change the name to “BEP”, but it will make your job easier if you do.
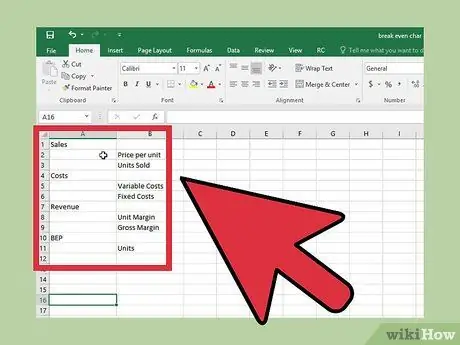
Step 2. Set the layout for the break-even worksheet
For the sake of this example, create a worksheet using the following layout:
- A1: Sales - This is the label for the Sales section of the worksheet.
- B2: Price Per Unit - This is the price charged for each item sold.
- B3: Units Sold - This is the number of units sold at a set price in a given time span.
- A4: Costs - This is the label for the Costs section of the worksheet.
- B5: Variable Costs - These are the product costs you can control (shipping, commission rate, etc.)
- B6: Fixed Costs - These are the product costs that you have no control over (facility rental, insurance, etc.)
- A7: Revenue - This is the amount of money generated from selling the product before deducting costs.
- B8: Unit Margin - This is the amount of money made per unit after deducting costs.
- B9: Gross Profit Margin - This is the total amount of money generated from selling units of product after deducting costs.
- A10: BEP - This is the label for the break-even point section of the worksheet.
- B11: Units - This is the number of units that need to be sold to cover production costs.
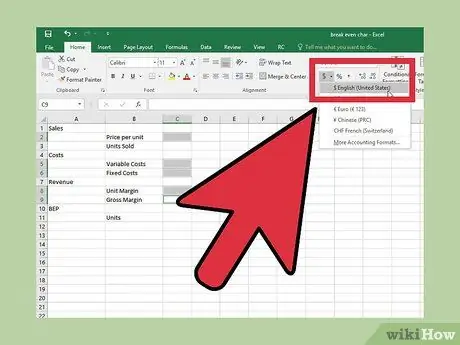
Step 3. Change the numeric format for the output and input cells
You need to change the numeric format for specific cells so that the data appears correctly:
- Highlight C2, C5, C6, C8, and C9. Click the drop down menu in the “Number” section of the Home label and select “Currency “.
- Highlight C3 and C11. Click the dropdown menu and select "More number formats". Select " Number " and set " Decimal places " to "0".
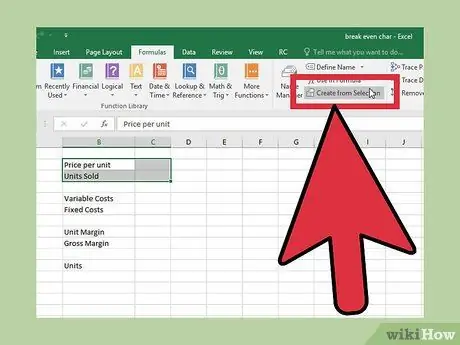
Step 4. Create a range to use in formulas
Select and create the following ranges for the formula to work. This way, variables can be created to be entered into formulas so that you can easily track and update their values.
- Select B2:C3 then click the "Formulas" label. Click “Create from selection” and continue with “OK”.
- Select B5:C6 then click the "Formulas" label. Click “Create from selection” and continue with “OK”.
- Select B8:C9 then click the "Formulas" label. Click “Create from selection” and continue with “OK”.
- Select B11:C11 then click the "Formulas" label. Click " Create from selection " and continue with "OK".
Part 4 of 5: Entering Formulas
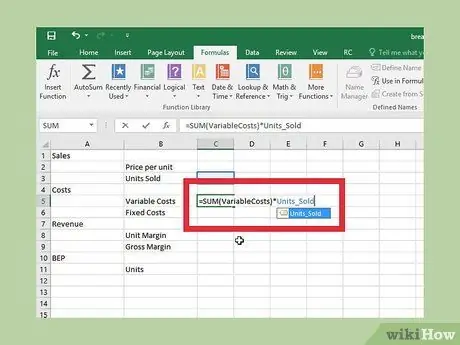
Step 1. Enter the variable cost formula
This formula will calculate the total variable cost for the goods sold. Click C5 and enter the following formula:
=SUM(Variable Cost)*Units_Sold
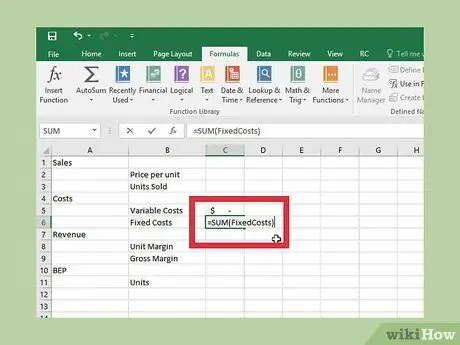
Step 2. Plug the fixed costs into the formula
Excel will calculate the total fixed cost of your product. Click C6 and enter the following formula:
=SUM(Fixed Cost)
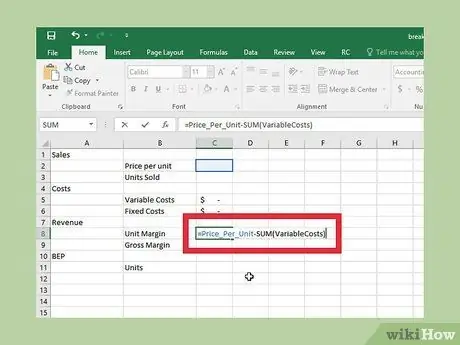
Step 3. Enter the unit margin formula
This formula will calculate the resulting margin after including the variable costs. Click C8 and enter the following formula:
=Price_Per_Unit-SUM(Cost Variable)
Step 4. Enter the gross profit margin formula
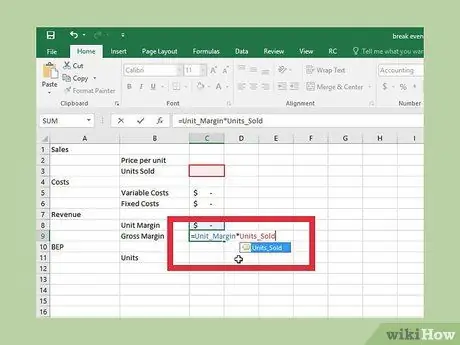
This formula determines the total profit amount for all units after deducting variable costs. Click C9 and enter the following formula:
=Margin_Unit*Unit_Sold
Step 5. Enter the BEP formula
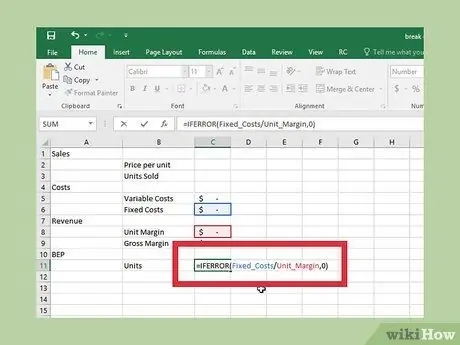
This formula takes fixed costs and compares them to the margin so you know how many units you need to sell in order to break even. Click C11 and enter the following formula:
=IFERROR(Fixed_Cost/Unit_Margin, 0)
Part 5 of 5: Determining the Break Even Point
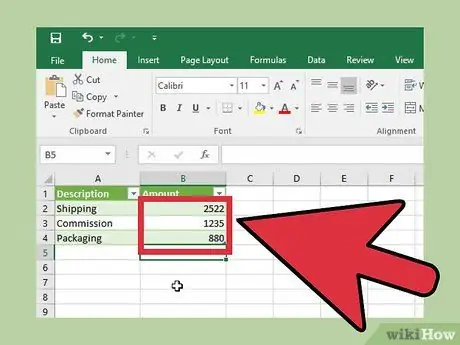
Step 1. Enter your business's variable costs
Return to the Variable Costs table and fill in all costs associated with the product. The more accurate the costs registered, the more accurate the calculations will be.
Each cost in the Variable Costs table must be per unit sold
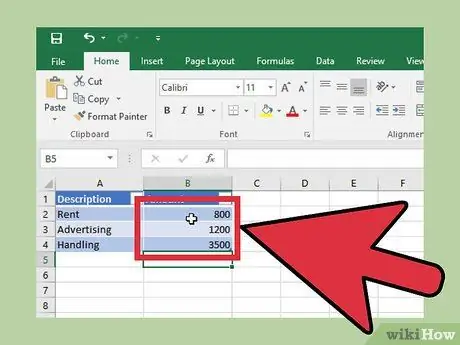
Step 2. Enter your business's fixed costs
Enter these costs into the fixed costs table. These are the costs of running a business, all set in equal intervals (eg monthly fees).
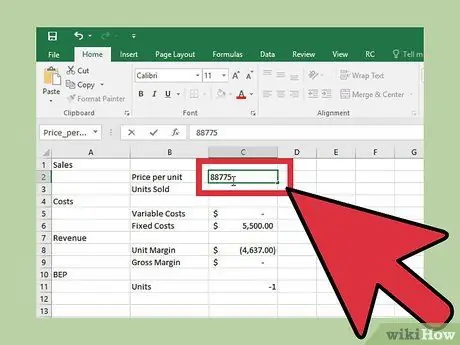
Step 3. Enter the price per unit
In the BEP worksheet, enter the estimated price per unit. You will be able to adjust it as the calculation progresses.
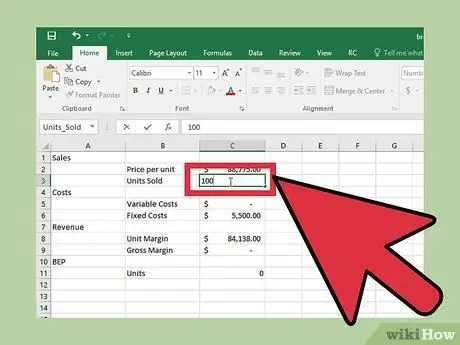
Step 4. Enter the number of units you want to sell
This is the desired sales figure in the same timeframe as Fixed Costs. For example, if your fixed costs include monthly rent and insurance, Units Sold is the number of units sold over the same time span.
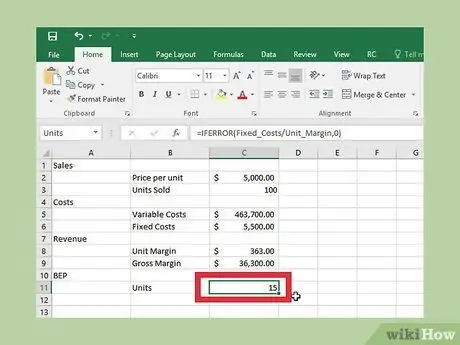
Step 5. Read the "Unit" output
The Units output cell (C11) will display the number of units that will need to be sold in order to break even. This figure will change depending on the Per Unit price as well as your Variable Cost and Fixed Cost tables.
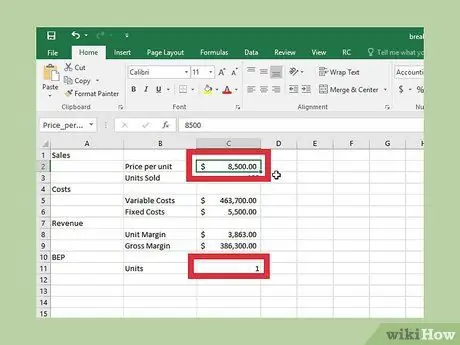
Step 6. Make adjustments to prices and costs
Changing the Price Per Unit will also change the number of units required to break even. Try changing the selling price of the unit and see the impact on the BEP value.


