- Author Jason Gerald [email protected].
- Public 2024-01-11 03:37.
- Last modified 2025-01-23 12:04.
You can easily run multiple regression analyzes using Excel when you don't have up-to-date statistical software. The analysis process is quick and easy to learn.
Step

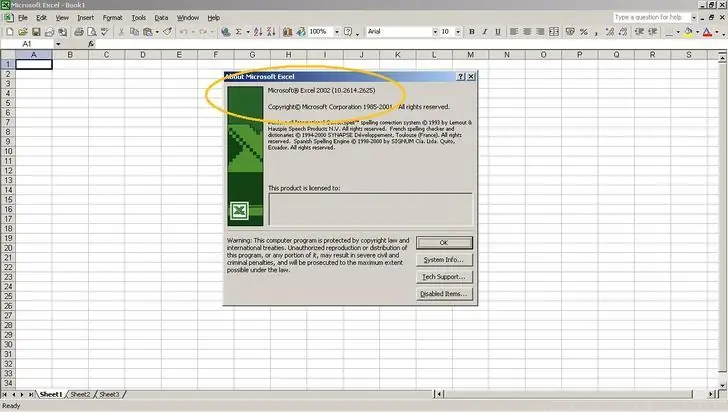
Step 1. Open Microsoft Excel
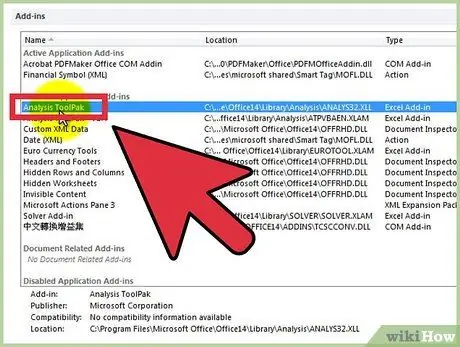
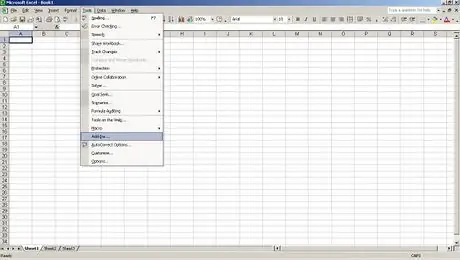
Step 2. Check if the “Data Analysis” ToolPak is active by clicking on the “Data” label
If you don't see this option, perform the following steps to enable the add-in:
- Open the "File" menu (or press Alt+F) and select "Options"
- Click "Add-Ins" on the left side of the window.
- Click "Go" next to the "Manage: Add-ins" option at the bottom of the window.
-

Image Check the box next to " Analysis ToolPak " in the new window, then click "OK".

Image -

Image 
Image Now, your add-in is active.
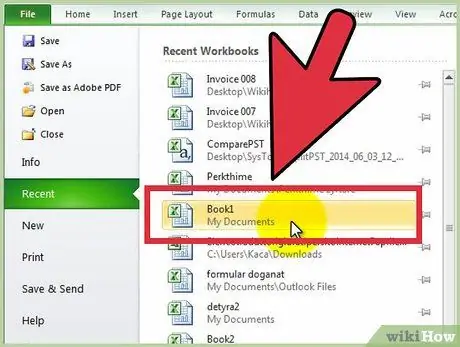
Step 3. Enter the data, or open the data file
The data must be arranged in columns that are next to each other and the labels/titles are in the first row in each column.
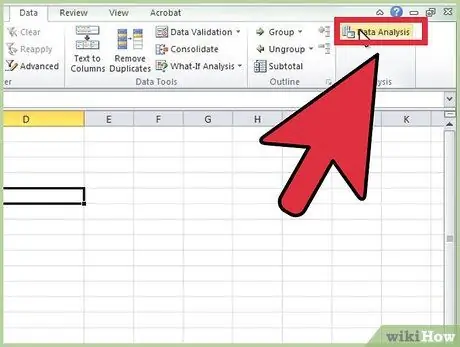
Step 4. Select the "Data" label, then click " Data Analysis " in the " Analysis " group (it may be at or near the far right of the Data options label)
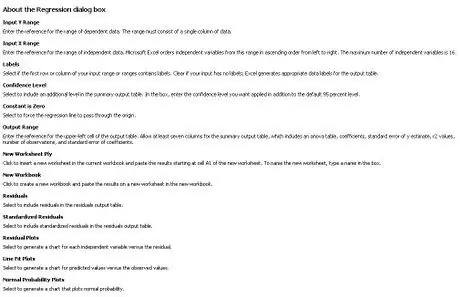
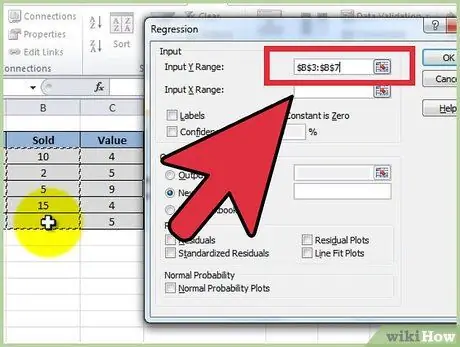
Step 5. Enter the dependent variable (Y) data by placing the cursor in the " Input Y-Range " box, then highlighting the corresponding data column in the workbook
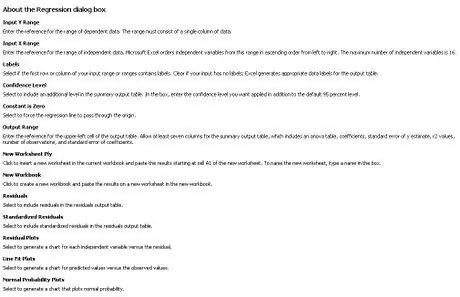
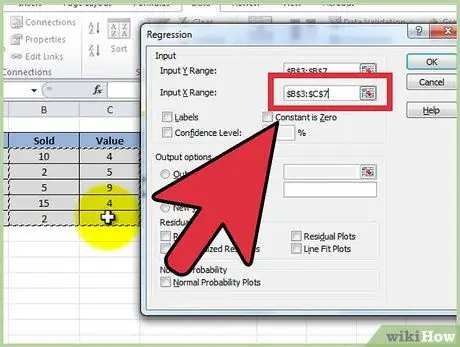
Step 6. Enter the independent variable data by placing the cursor in the " Input X-Range " box, then highlight some related data fields in the workbook (eg $C$1:
$E$53).
- Note: independent variable data fields MUST be next to each other for input to be analyzed properly.
- If you're using labels or headings (again, headings are in the first row of each column), click the box next to " Labels ".
- The initial confidence level (default confidence level) is 95%. If you want to change it, click the box next to " Confidence Level " and change the value.
- Under "Output Options", enter a name in the "New Worksheet Ply" box.
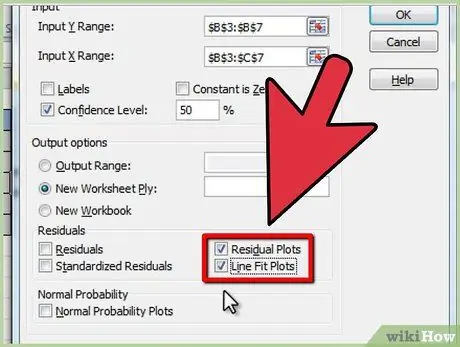
Step 7. Select the desired option in the " Residuals " category
Graphical residual output is created with the " Residual Plots " and " Line Fit Plots " options.


