- Author Jason Gerald [email protected].
- Public 2024-01-02 02:28.
- Last modified 2025-01-23 12:04.
Scientific research often relies on surveys distributed to a specific sample of the population. If you want the sample to represent the population condition accurately, determine the appropriate number of samples. To calculate the required number of samples, you must define some numbers and enter them into the appropriate formula.
Step
Part 1 of 4: Determining Key Numbers

Step 1. Know the population size
Population count is the total number of people who meet the demographic criteria you're using. For large studies, you can use estimates to substitute for exact values.
- Accuracy has a more significant effect when your focus is smaller. For example, if you want to conduct a survey of members of a local organization or small business employees, the population count should be accurate if the number of people is under or around twelve people.
- Large surveys allow for slack in population numbers. For example, if your demographic criterion is all people living in Indonesia, you could use an estimate of a population of 270 million, although the actual figure may be several hundred thousand higher or lower.

Step 2. Determine the margin of error
The margin of error or “confidence interval,” is the amount of error in the outcome you are willing to tolerate.
- The margin of error is a percentage that shows the precision of the results you get from the sample when compared to the actual results of the entire study population.
- The smaller the margin of error, the more accurate your answer will be. However, the sample you need will get bigger.
-
When survey results are displayed, the margin of error is usually represented as a plus or minus percentage. Example: "35% of citizens agree with choice A, with a margin of error of +/- 5%"
In this example, the margin of error indicates that if the entire population were asked the same question, you "believe" that between 30% (35 - 5) and 40% (35 + 5) would agree with choice A

Step 3. Determine the level of confidence
The concept of confidence level is closely related to the confidence interval (margin of error). This number indicates how much you believe in how well the sample represents the population within the margin of error.
- If you select the 95% confidence level, you are 95% sure that the results you get are accurate below the margin of error.
- A higher level of confidence results in higher accuracy, but you need a larger number of samples. The commonly used confidence levels are 90%, 95%, and 99%.
- Assume that you use a 95% confidence level for the example mentioned in the margin of error step. That is, you are 95% sure that 30% to 40% of the population will agree with choice A.

Step 4. Determine the standard deviation
The standard deviation or standard deviation indicates how much variation you expect between respondents' answers.
-
Extreme answers are usually more accurate than moderate answers.
- If 99% of respondents answered “Yes” and only 1% answered “No,” the sample is likely to represent the population accurately.
- On the other hand, if 45% answered “Yes” and 55% answered “No,” the possibility of an error is greater.
- Since this value is difficult to determine during surveys, most researchers use the number 0.5 (50%). This is the worst percentage scenario. This figure ensures that the sample size is large enough to accurately represent the population within the limits of the confidence interval and level of confidence.

Step 5. Calculate the Z-score or z-score
The Z-score is a constant value that is automatically determined based on the level of confidence. This number is the “standard normal score,” or the number of standard deviations (standard distance) between the respondent's answer and the population mean.
- You can calculate the z-score manually, use an online calculator, or find it using the z-score table. These methods are relatively complex.
-
Because there are several commonly used confidence levels, most researchers only remember the z scores for the most frequently used confidence levels:
- 80% confidence level => z score 1, 28
- 85% confidence level => z score 1, 44
- 90% confidence level => z score 1, 65
- 95% confidence level => z score 1, 96
- 99% confidence level => z score 2.58
Part 2 of 4: Using Standard Formulas
Step 1. Look at the equation
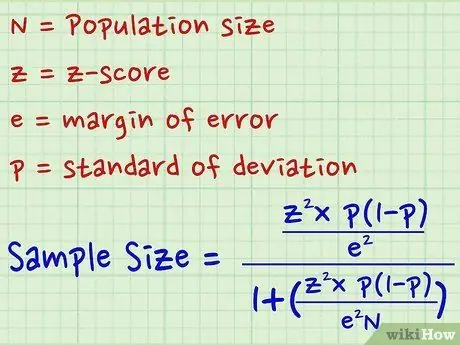
If you have a small to medium-sized population and all the key numbers are known, use a standard formula. The standard formula for determining sample size is:
-
Number of samples = [z2 * p(1-p)] / e2 / 1 + [z2 * p(1-p)] / e2 * N]
- N = population
- z = score z
- e = margin of error
- p = standard deviation
Step 2. Enter the numbers
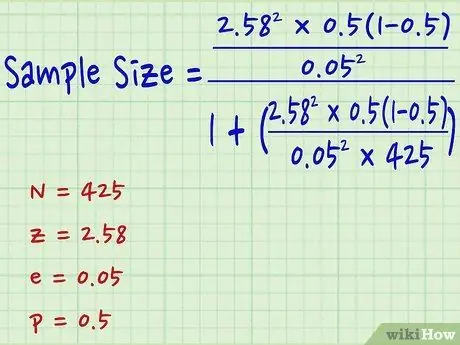
Replace the variable notation with the number of the specific survey you did.
- Example: Determine the ideal sample size for a population of 425 people. Use a 99% confidence level, 50% standard deviation, and 5% margin of error.
- For the 99% confidence level, the z-score is 2.58.
-
Means:
- N = 425
- z = 2.58
- e = 0.05
- p = 0.5
Step 3. Calculate
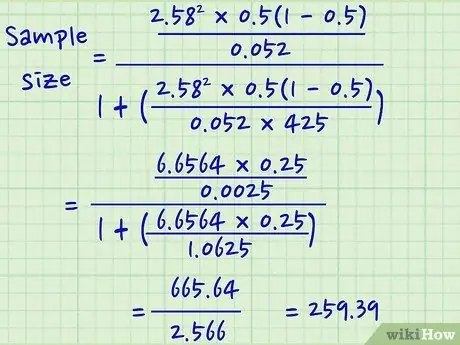
Solve the equation using the numbers. The result is the number of samples you need.
- Example: Number of samples = [z2 * p(1-p)] / e2 / 1 + [z2 * p(1-p)] / e2 * N ]
- = [2, 582 * 0, 5(1-0, 5)] / 0, 052 / 1 + [2, 582 * 0, 5(1-0, 5)] / 0, 052 * 425 ]
- = [6, 6564 * 0, 25] / 0.0025 / 1 + [6, 6564 * 0, 25] / 1, 0625 ]
- = 665 / 2, 5663
- = 259, 39 (final answer)
Part 3 of 4: Creating Formulas for Unknown or Very Large Populations
Step 1. Look at the formula
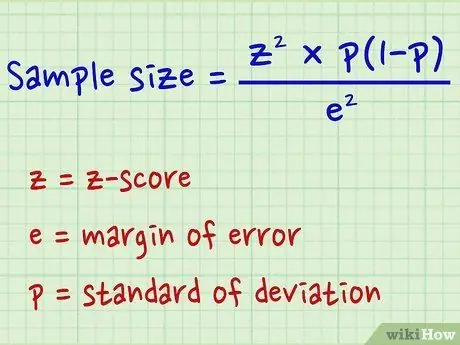
If you have a very large population or a population whose number of members is unknown, you must use the secondary formula. If the other key numbers are known, use the equation:
-
Number of samples = [z2 * p(1-p)] / e2
- z = score z
- e = margin of error
- p = standard deviation
- This equation is only the numerator part of the complete formula.
Step 2. Plug the numbers into the equation
Replace the variable notation with the number you used for the survey.
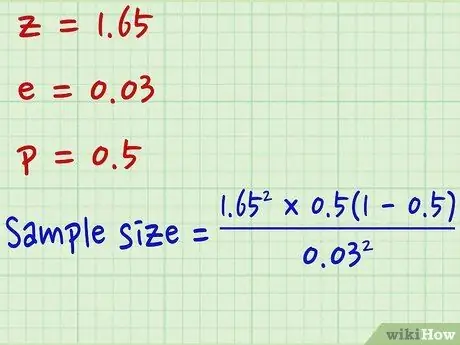
- Example: Determine the sample size for an unknown population with a 90% confidence level, 50% standard deviation, and a 3% margin of error.
- For the 90% confidence level, the z-score used is 1.65.
-
Means:
- z = 1.65
- e = 0.03
- p = 0.5
Step 3. Calculate
After plugging the numbers into the formula, solve the equation. The final answer is the number of samples required.
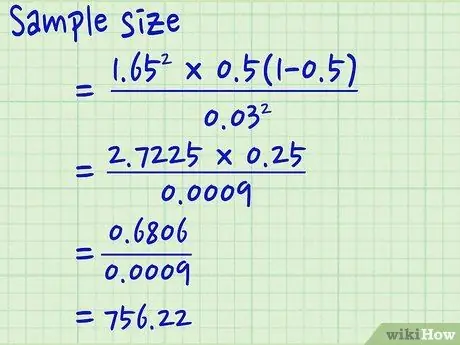
- Example: Number of samples = [z2 * p(1-p)] / e2
- = [1, 652 * 0, 5(1-0, 5)] / 0, 032
- = [2, 7225 * 0, 25] / 0, 0009
- = 0, 6806 / 0, 0009
- = 756, 22 (final answer)
Part 4 of 4: Part Four: Using the Slovin. Formula

Step 1. Look at the formula
The Slovin formula is a general equation that can be used to estimate a population when the character of the population is unknown. The formula used is:
-
Number of samples = N / (1 + N*e2)
- N = population
- e = margin of error
- Note that this is the least accurate formula so it is not ideal. Use this formula only if you can't figure out the standard deviation and confidence level so you can't determine the z-score anyway.
Step 2. Enter the numbers
Replace the notation of each variable with the survey-specific number.
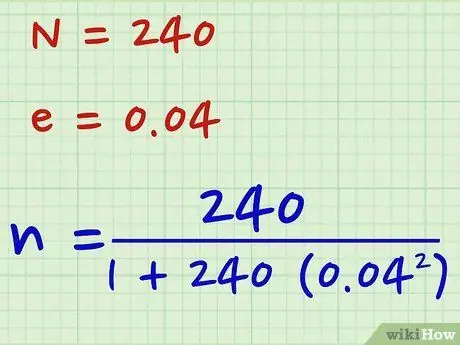
- Example: Calculate the sample size for a population of 240 with a margin of error of 4%.
-
Means:
- N = 240
- e = 0.04
Step 3. Calculate
Solve equations using numbers specific to your survey. The final answer is the number of samples you need.
-
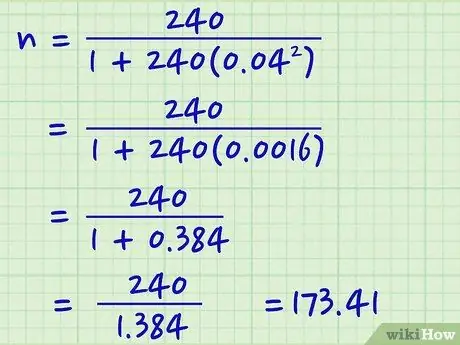
Example: Number of samples = N / (1 + N*e2)
- = 240 / (1 + 240 * 0, 042)
- = 240 / (1 + 240 * 0, 0016)
- = 240 / (1 + 0, 384)
- = 240 / (1, 384)
- = 173, 41 (final answer)


